Short and handy Okta Workflows tips and tricks. Read the full series.
In Okta Workflows, the execution history tracks the number of steps each card and the overall flow take to run. Monitoring these counts helps identify resource-intensive automations that may impact performance or exceed platform execution limits.
From the Okta Workflows docs:
The number of steps executed by the Okta engine to execute the card. This is an approximate measure of the system load required to execute this card.
To view the steps, open the Execution History view, select an execution from the right panel, and then open the History Inspector view (the green tab).
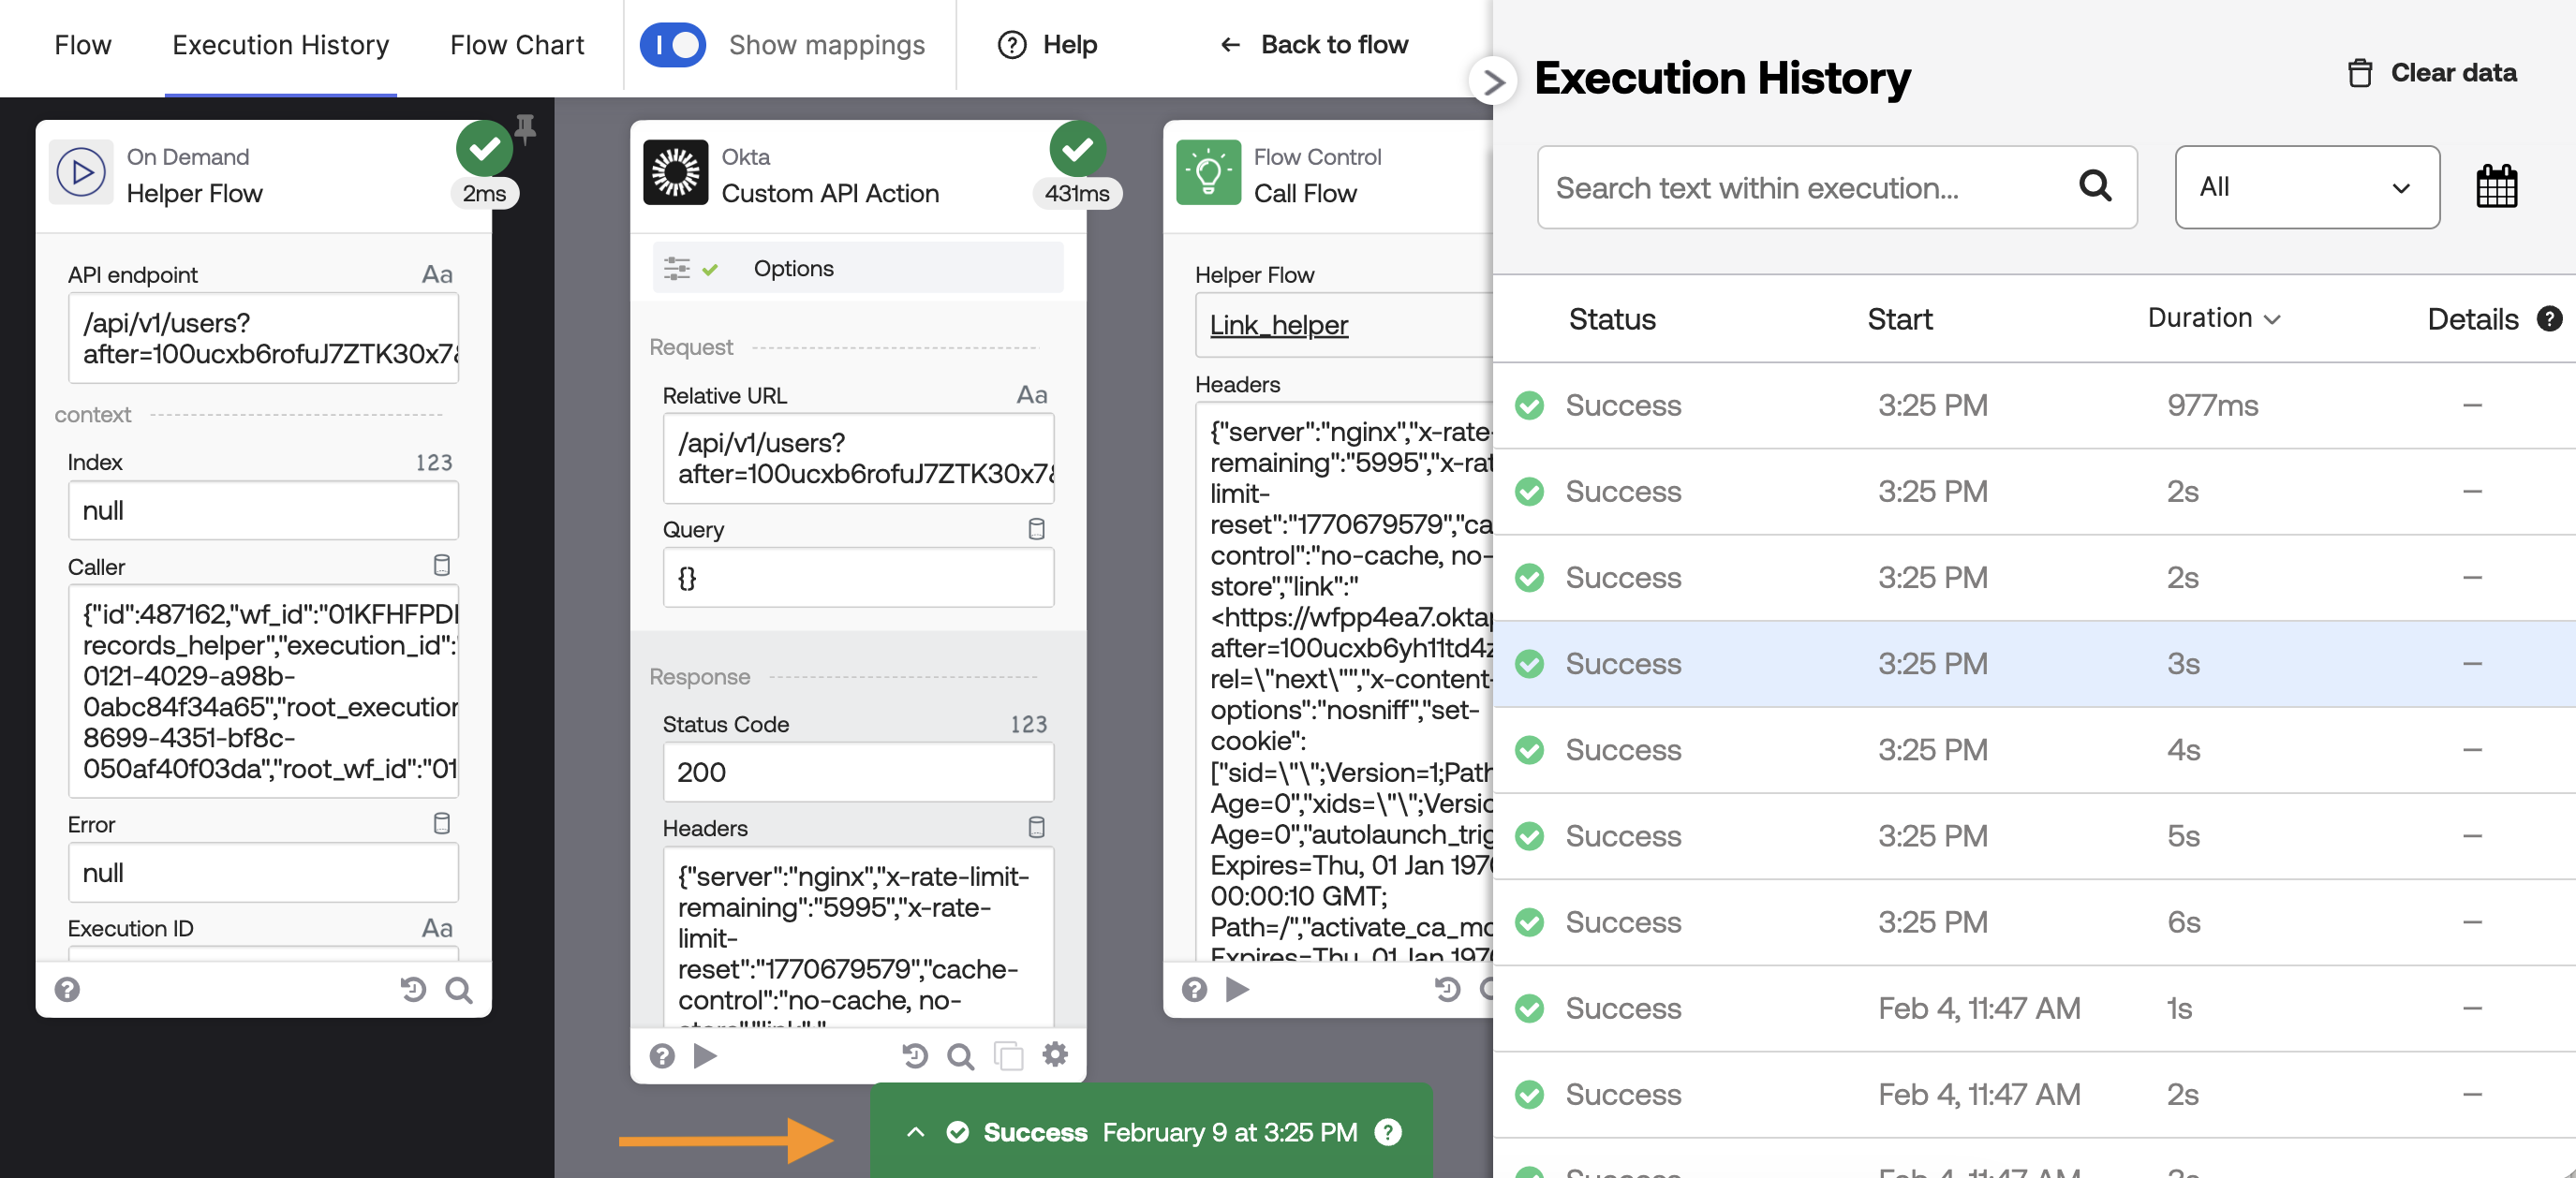
The History Inspector shows the step count for each individual card and the total for the entire flow.
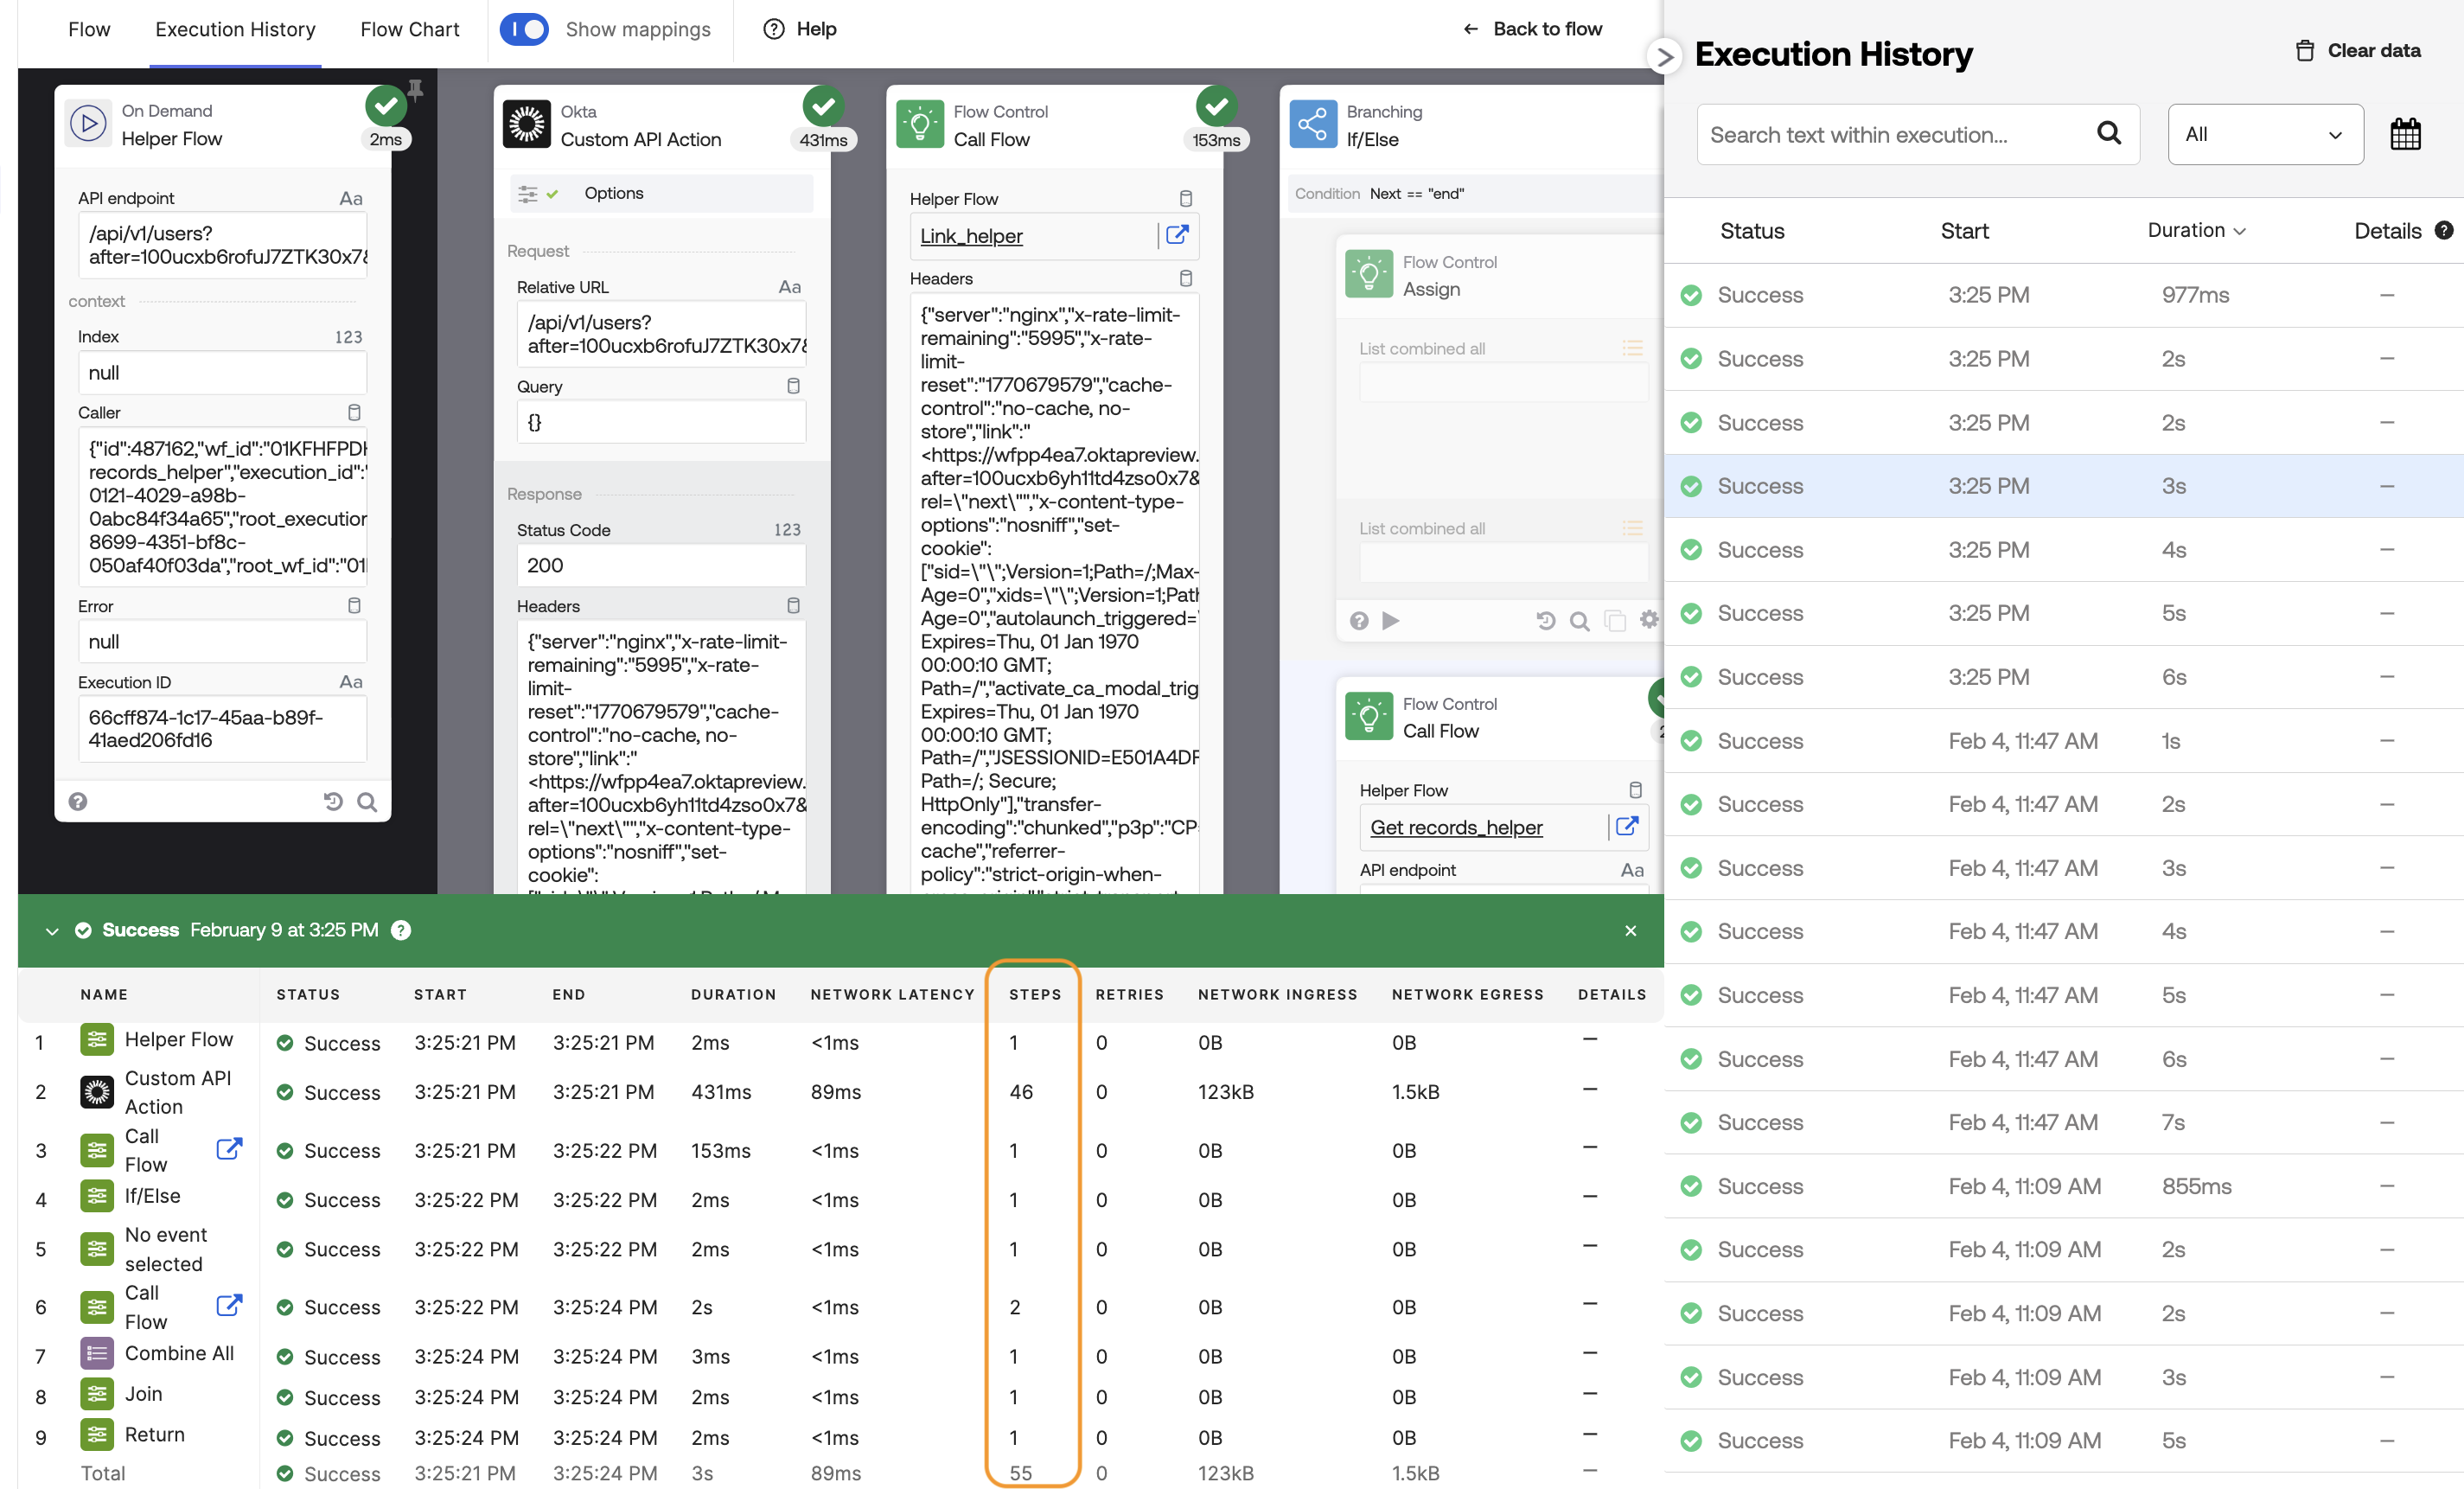
The step count indicates the effort the Okta engine expends to process a card and serves as a measure of system load. For example, cards that invoke external APIs typically require more steps to process. As seen in the screenshot, the Okta-Custom API Action card uses 55 steps, whereas the List – Combine All card requires only one.
A card also has the Inspect history button. Clicking on that button will jump and select the execution history for that card:
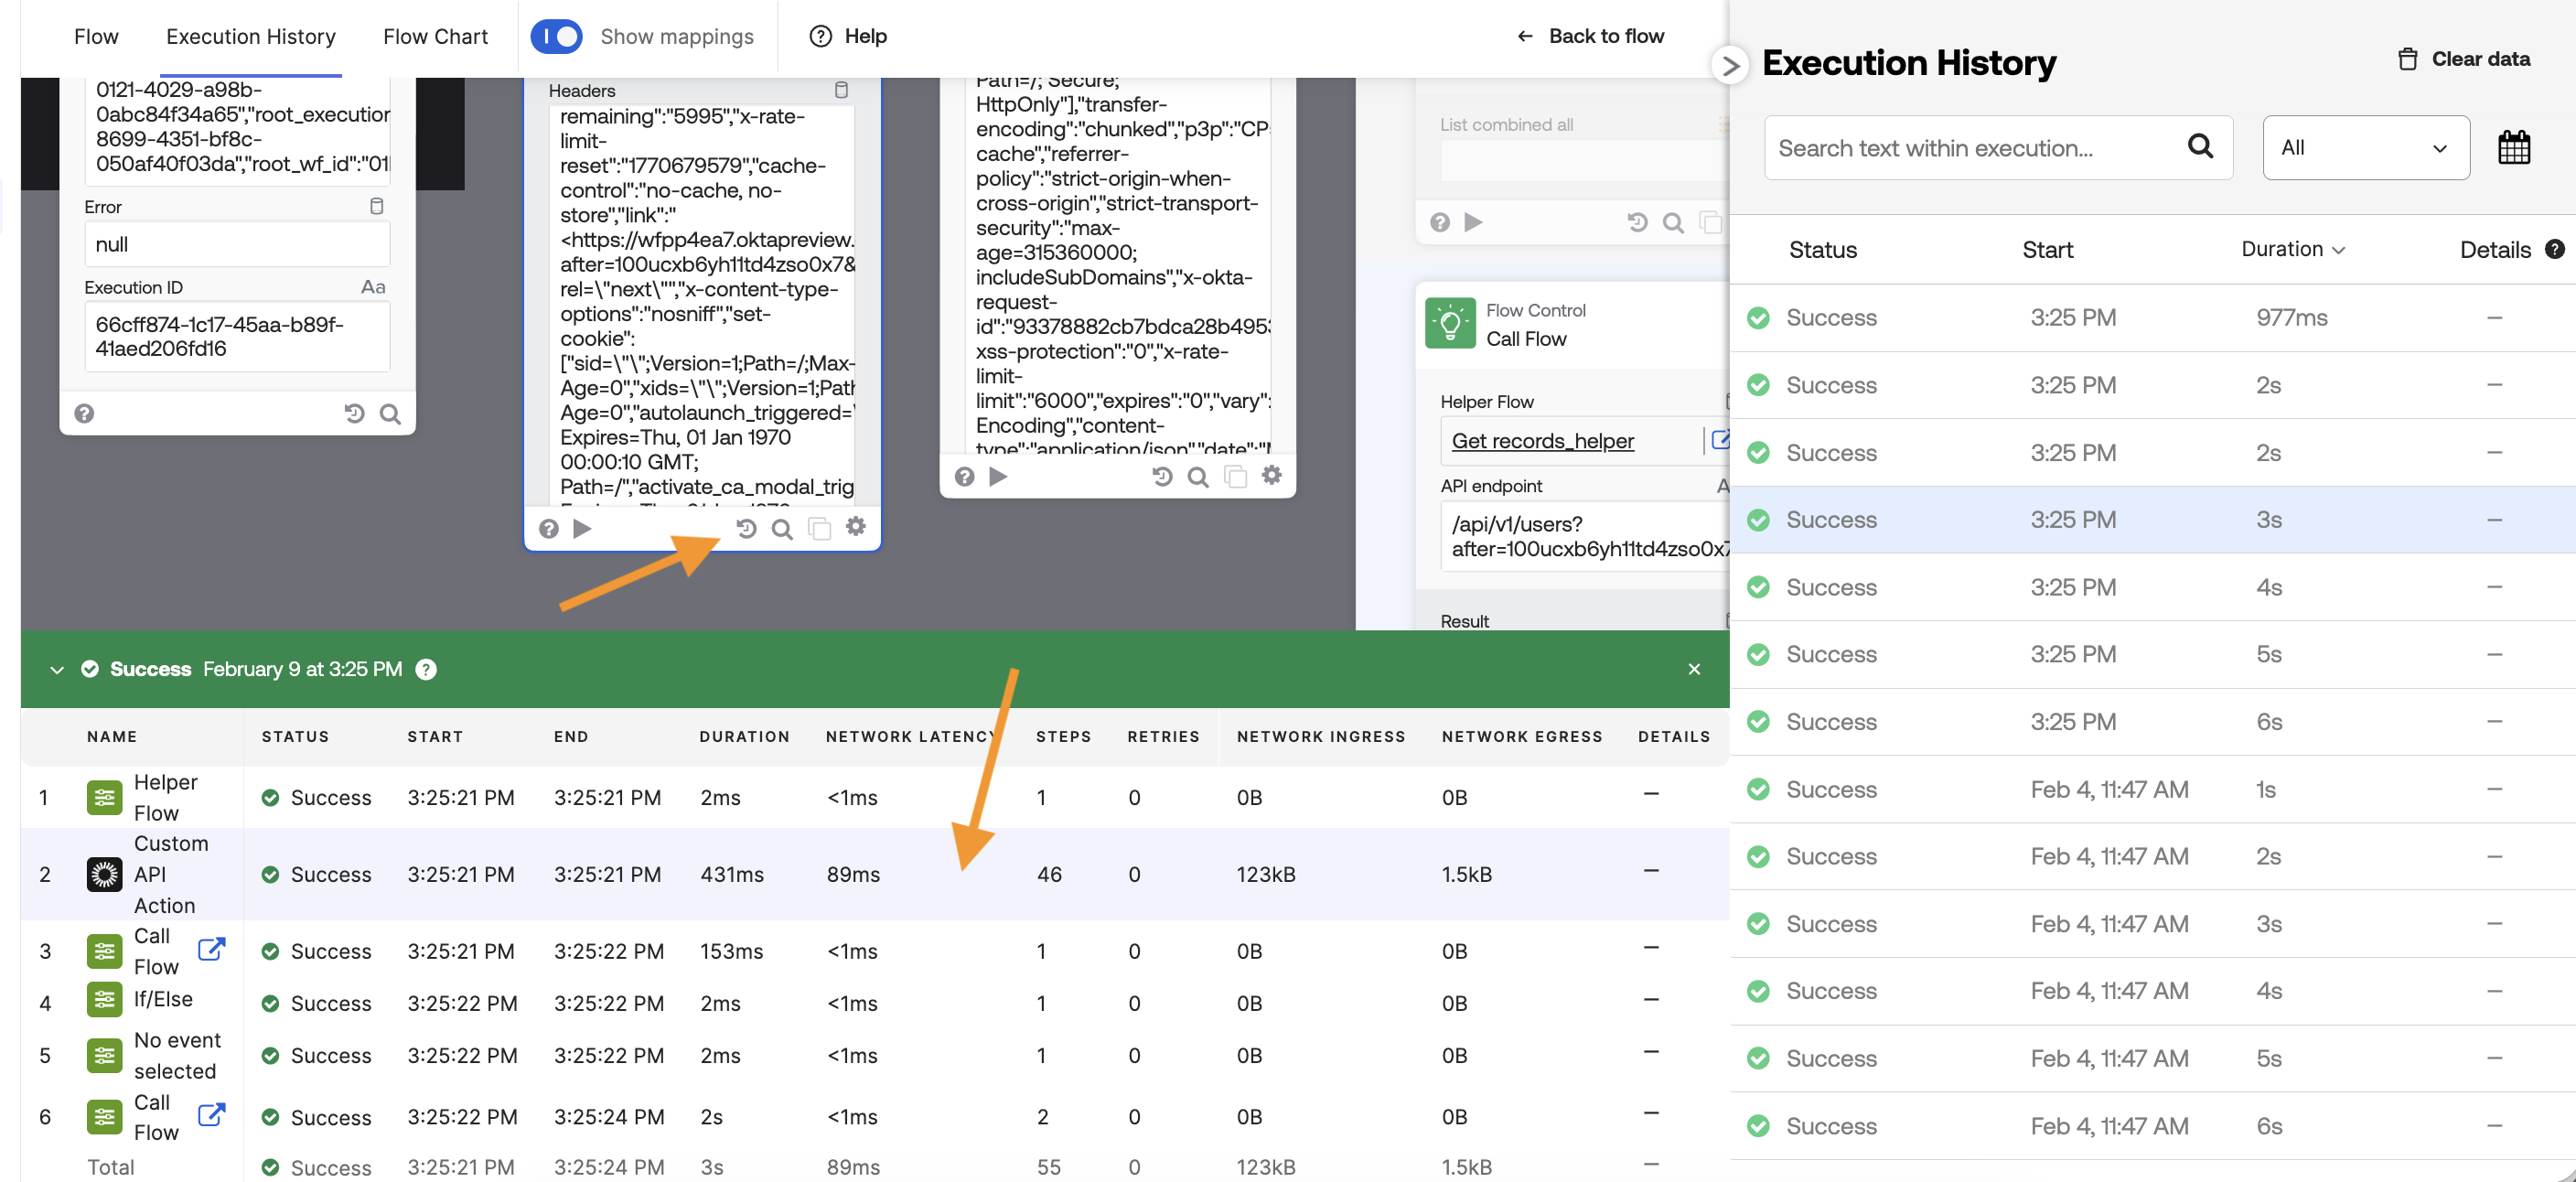
In addition to Steps, the History Inspector view displays the following information for each card:
- Name
- Status
- Start
- End
- Duration
- Network Latency
- Steps
- Retries
- Network Ingress
- Network Egress
- Details
Learn more about these metrics in the History Inspector details.
Okta Workflows resources
🚀 New to Okta Workflows? The Getting Started with Okta Workflows page has all the resources to help you get started.
📺 Like learning from videos? Watch Okta Workflows videos.
❓Have a question? Ask during community office hours, post on the community forum, or email me.
🙋🏻♀️ Want to learn from the community? Join the #okta-workflows channel on the Mac Admins Slack.
📖 Want to learn more about Okta and automation? Take the Okta Workflows training on Okta Learning.

Leave a comment