Short and handy Okta Workflows tips and tricks. Read the full series.
6 Performance Metrics in Execution History
When viewing a flow’s Execution History, the default view is Duration, or how long the flow ran.
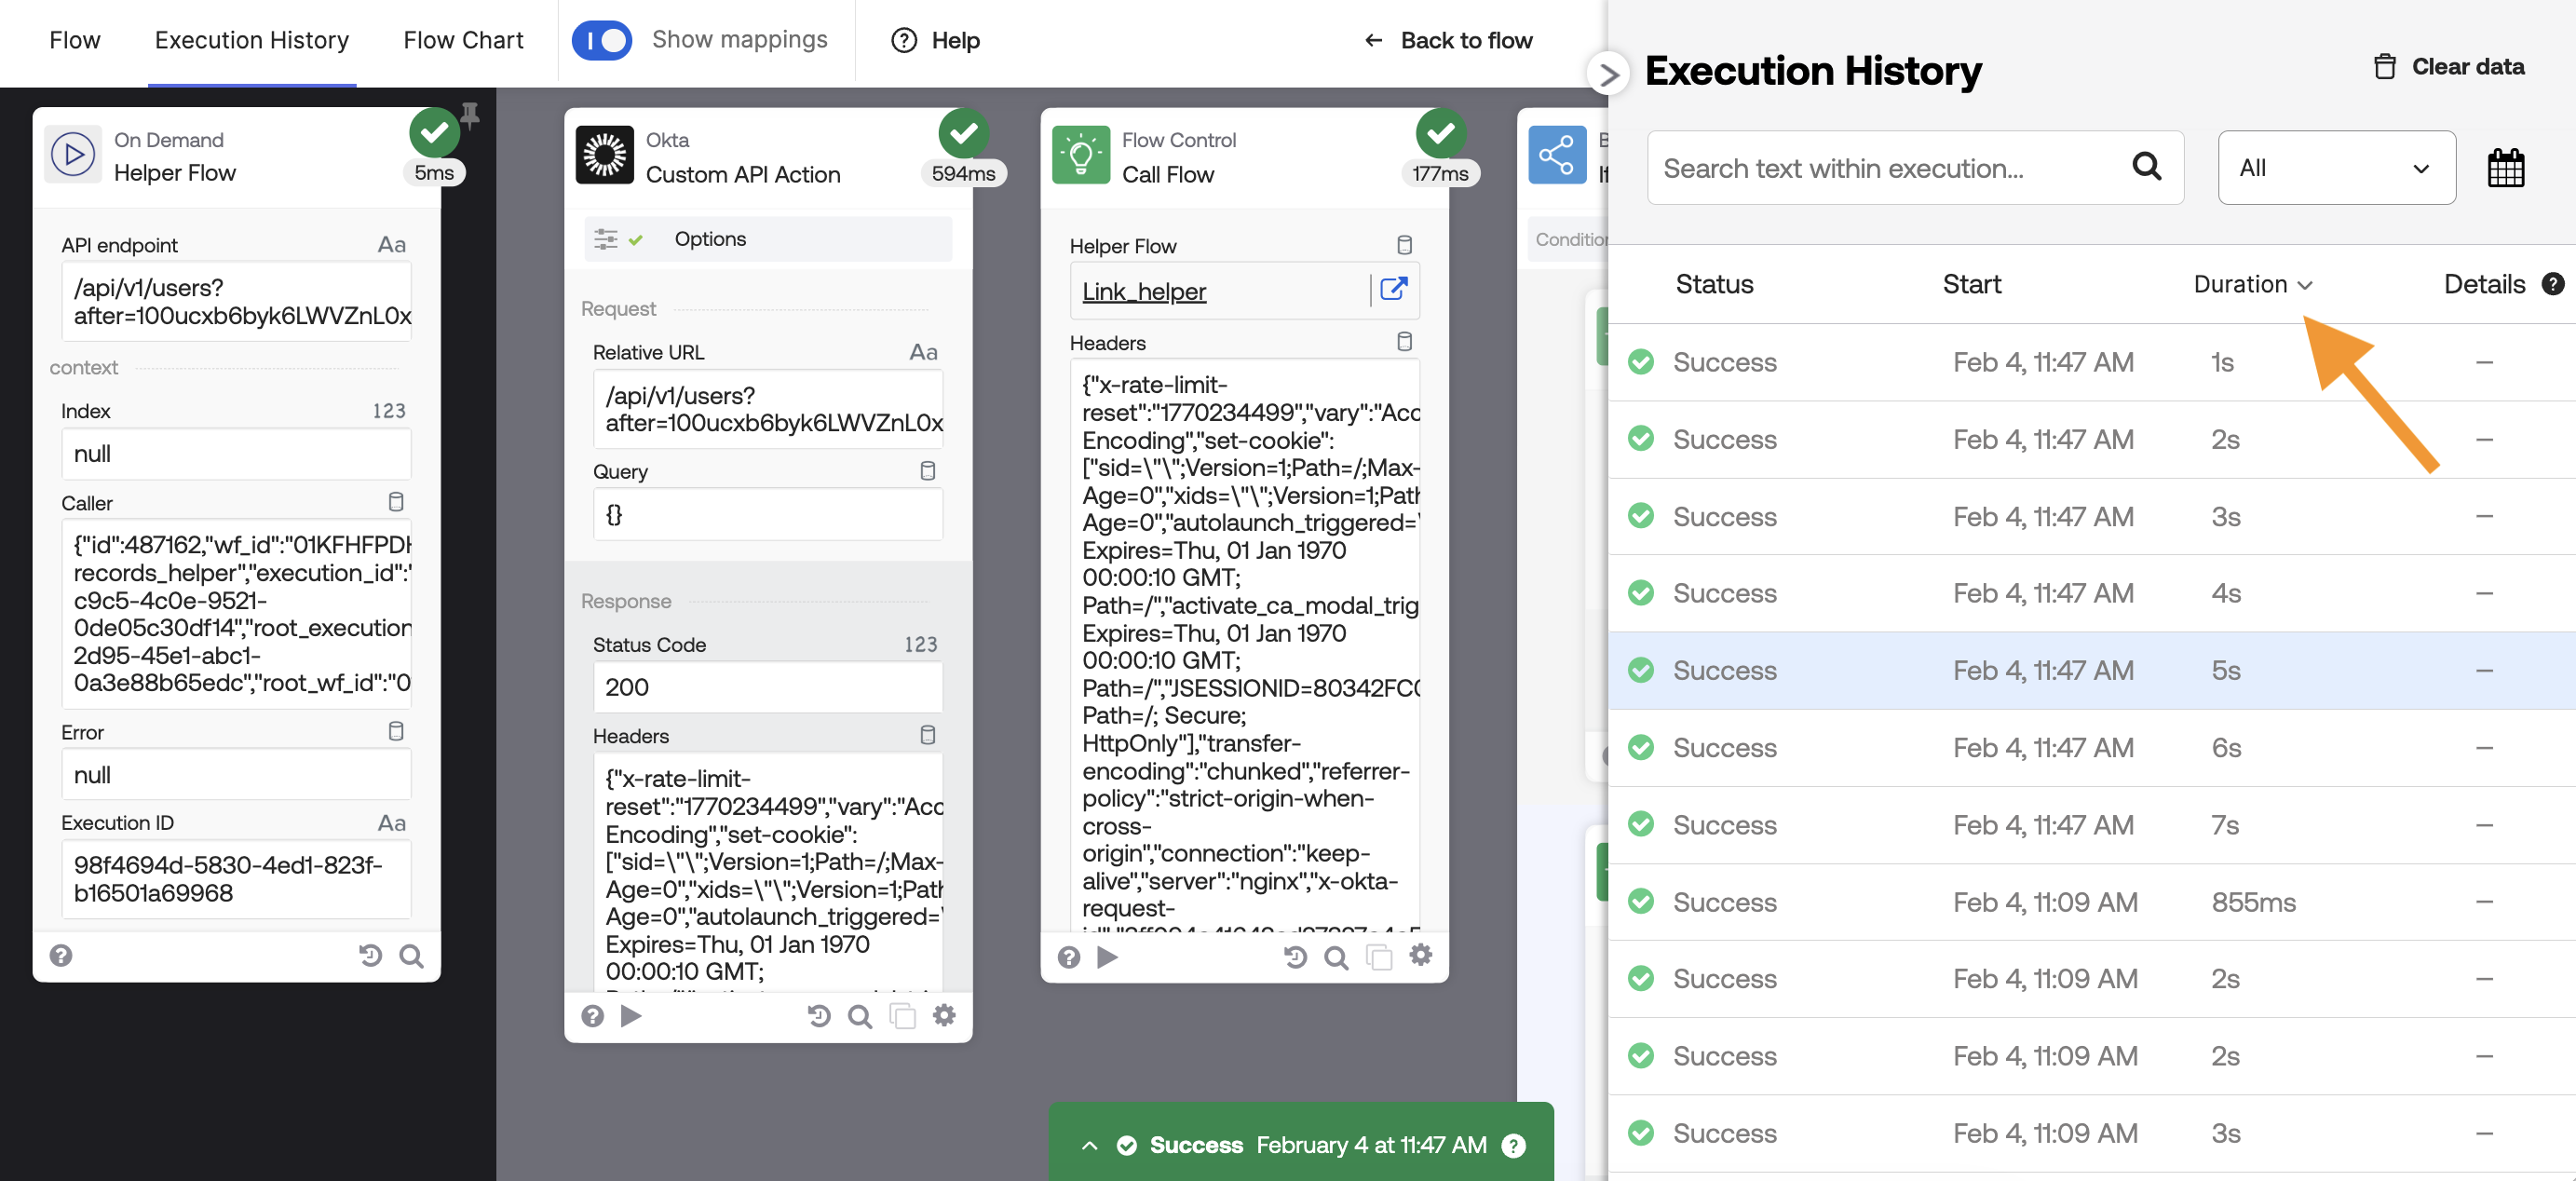
Click the down-arrow to see other flow metrics:
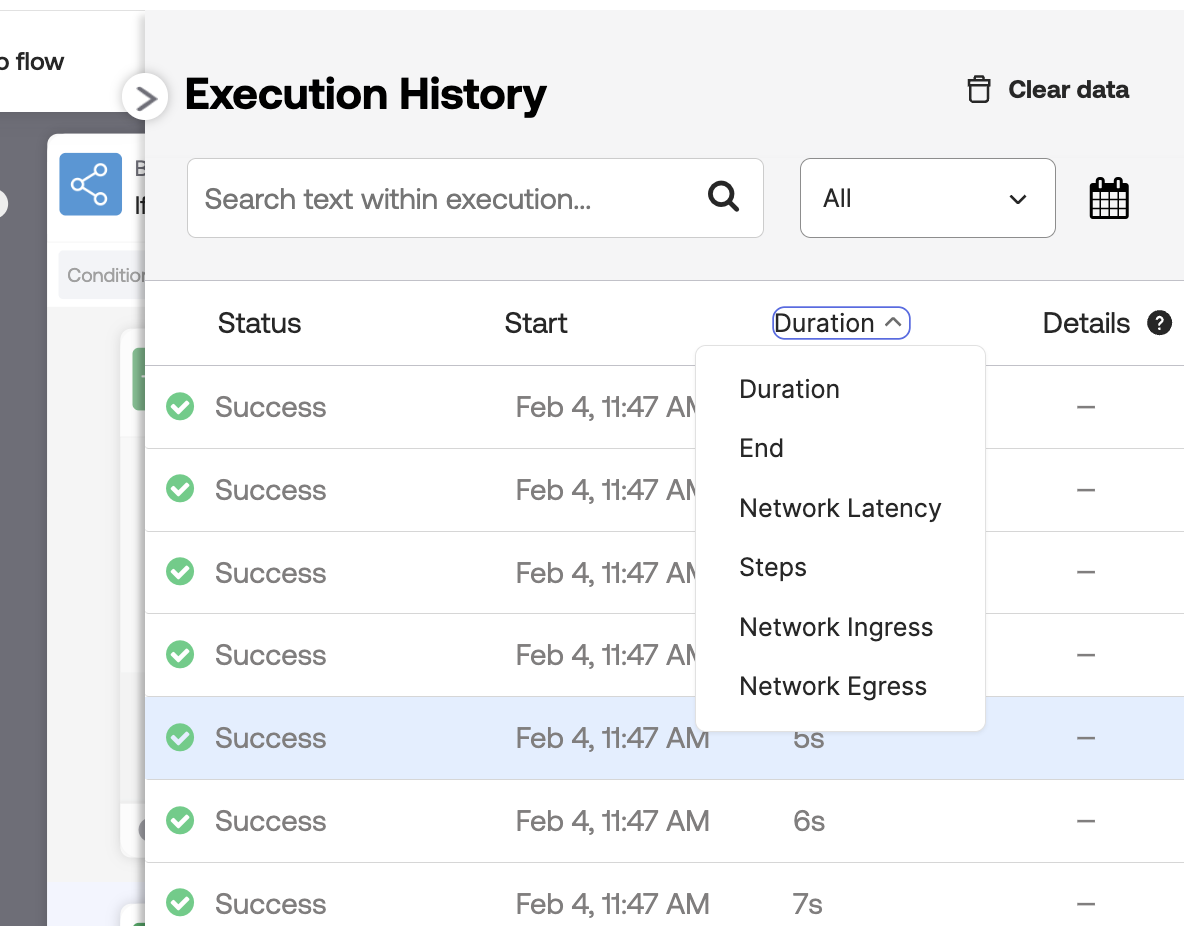
- Duration: The total time from start to finish.
- End: The specific time the flow ended execution.
- Network Latency: The time spent waiting for external systems/APIs to respond.
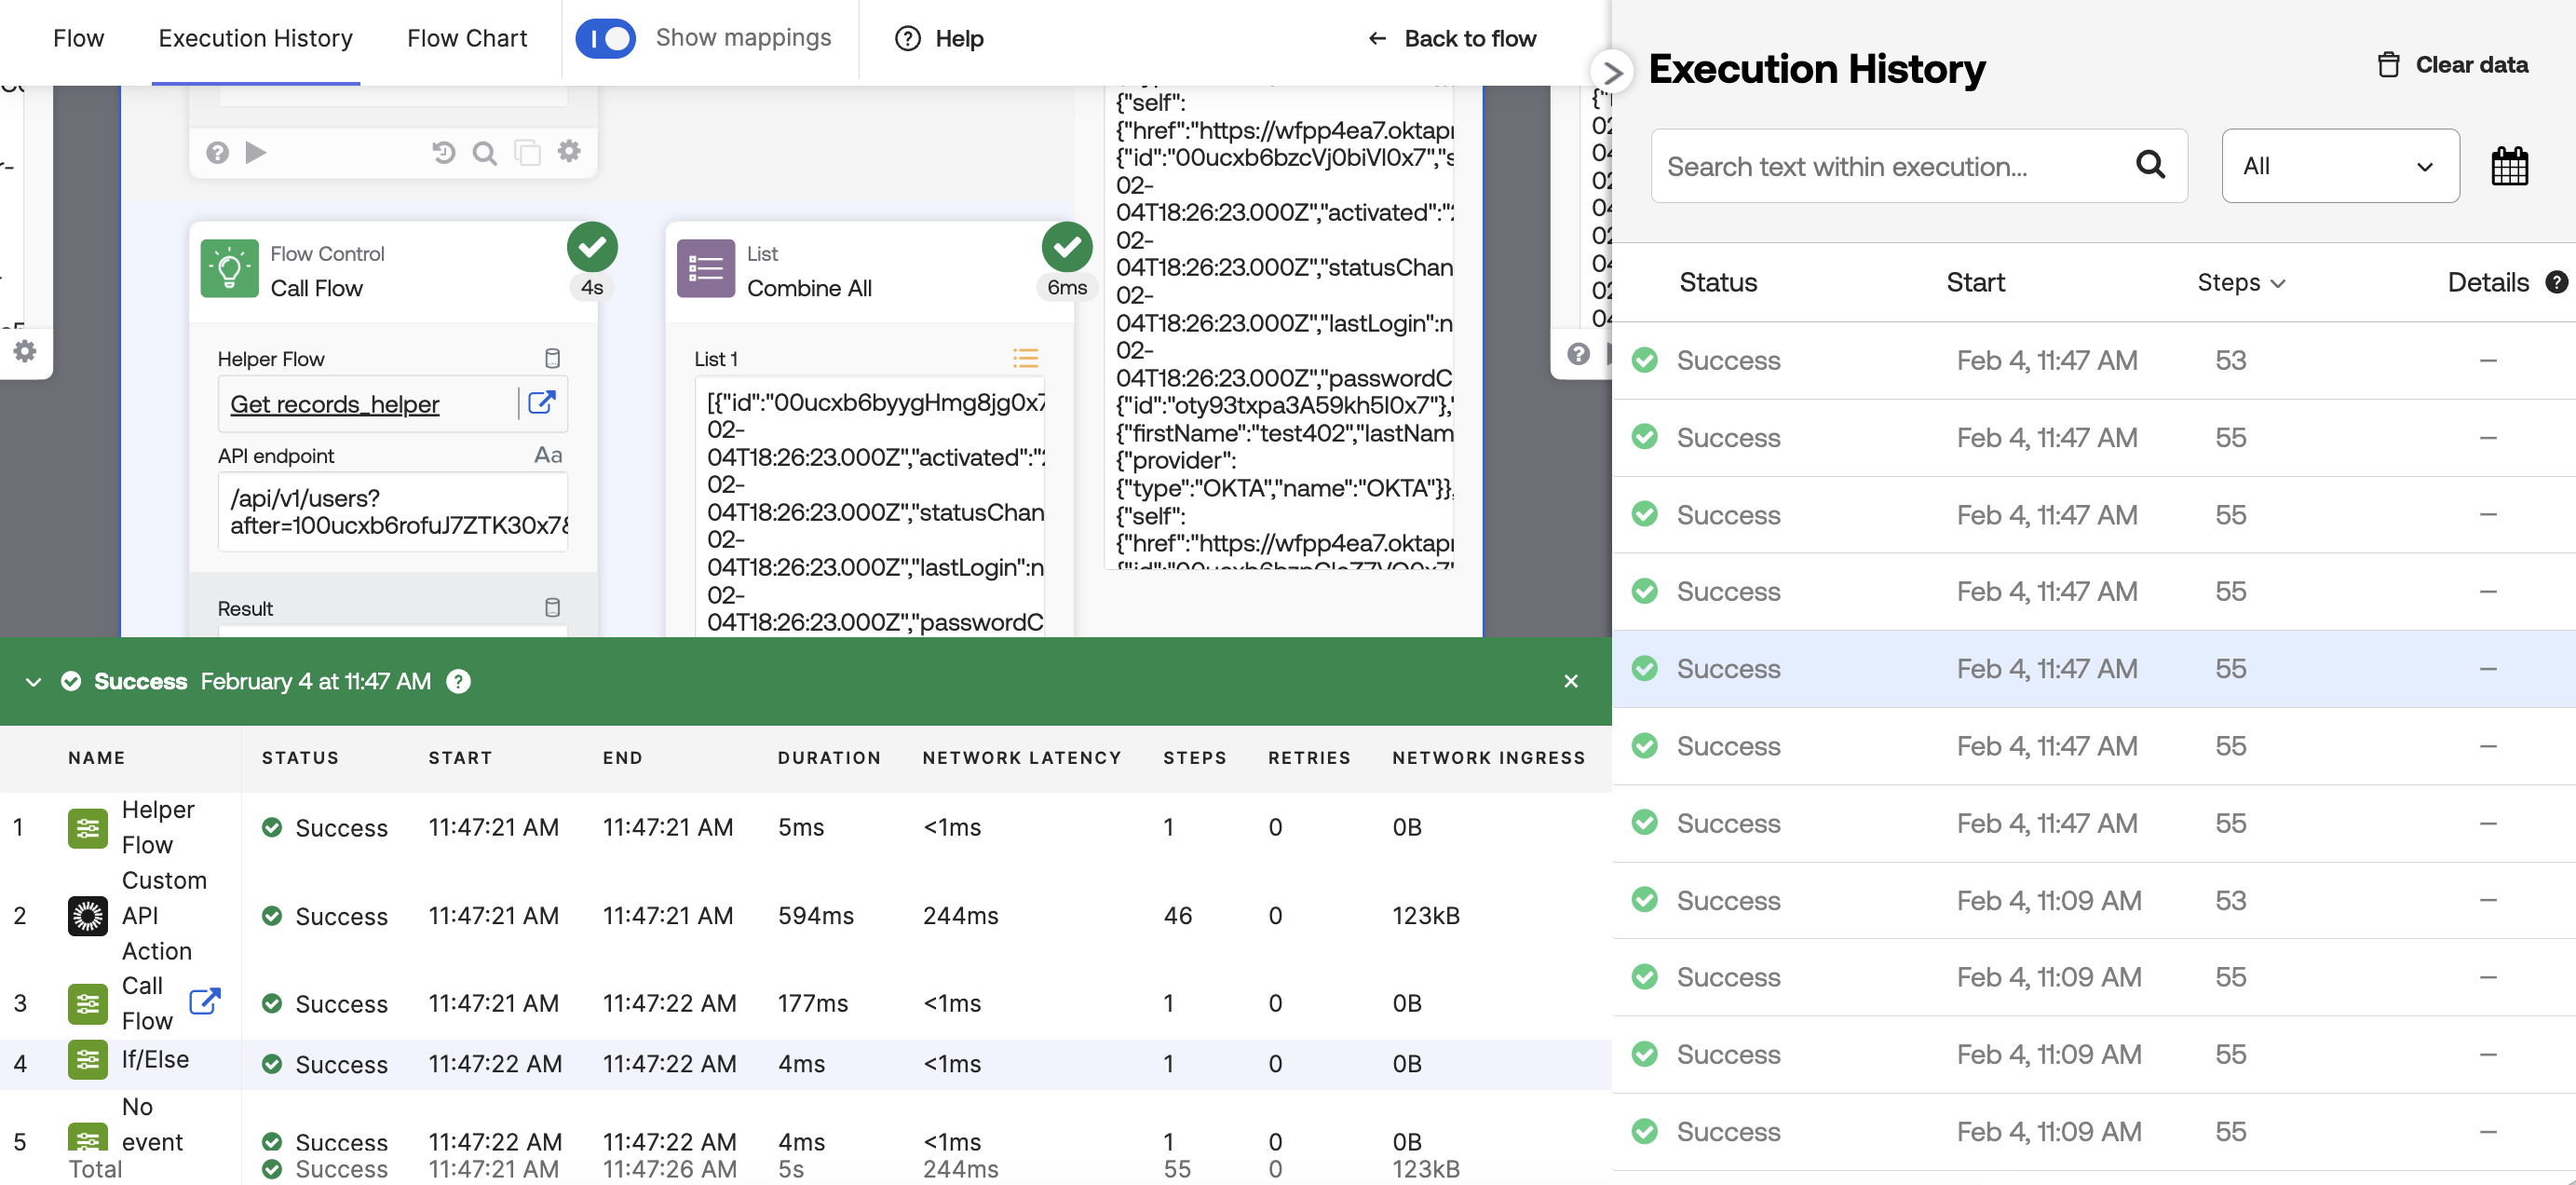
- Steps: The total count of steps the flow took to execute. Open the History Inspector view (the green panel inside the flow) to see the count for each card.
- Network Ingress: The size of the data payload received by the flow.
- Network Egress: The size of the data payload sent out to other services.
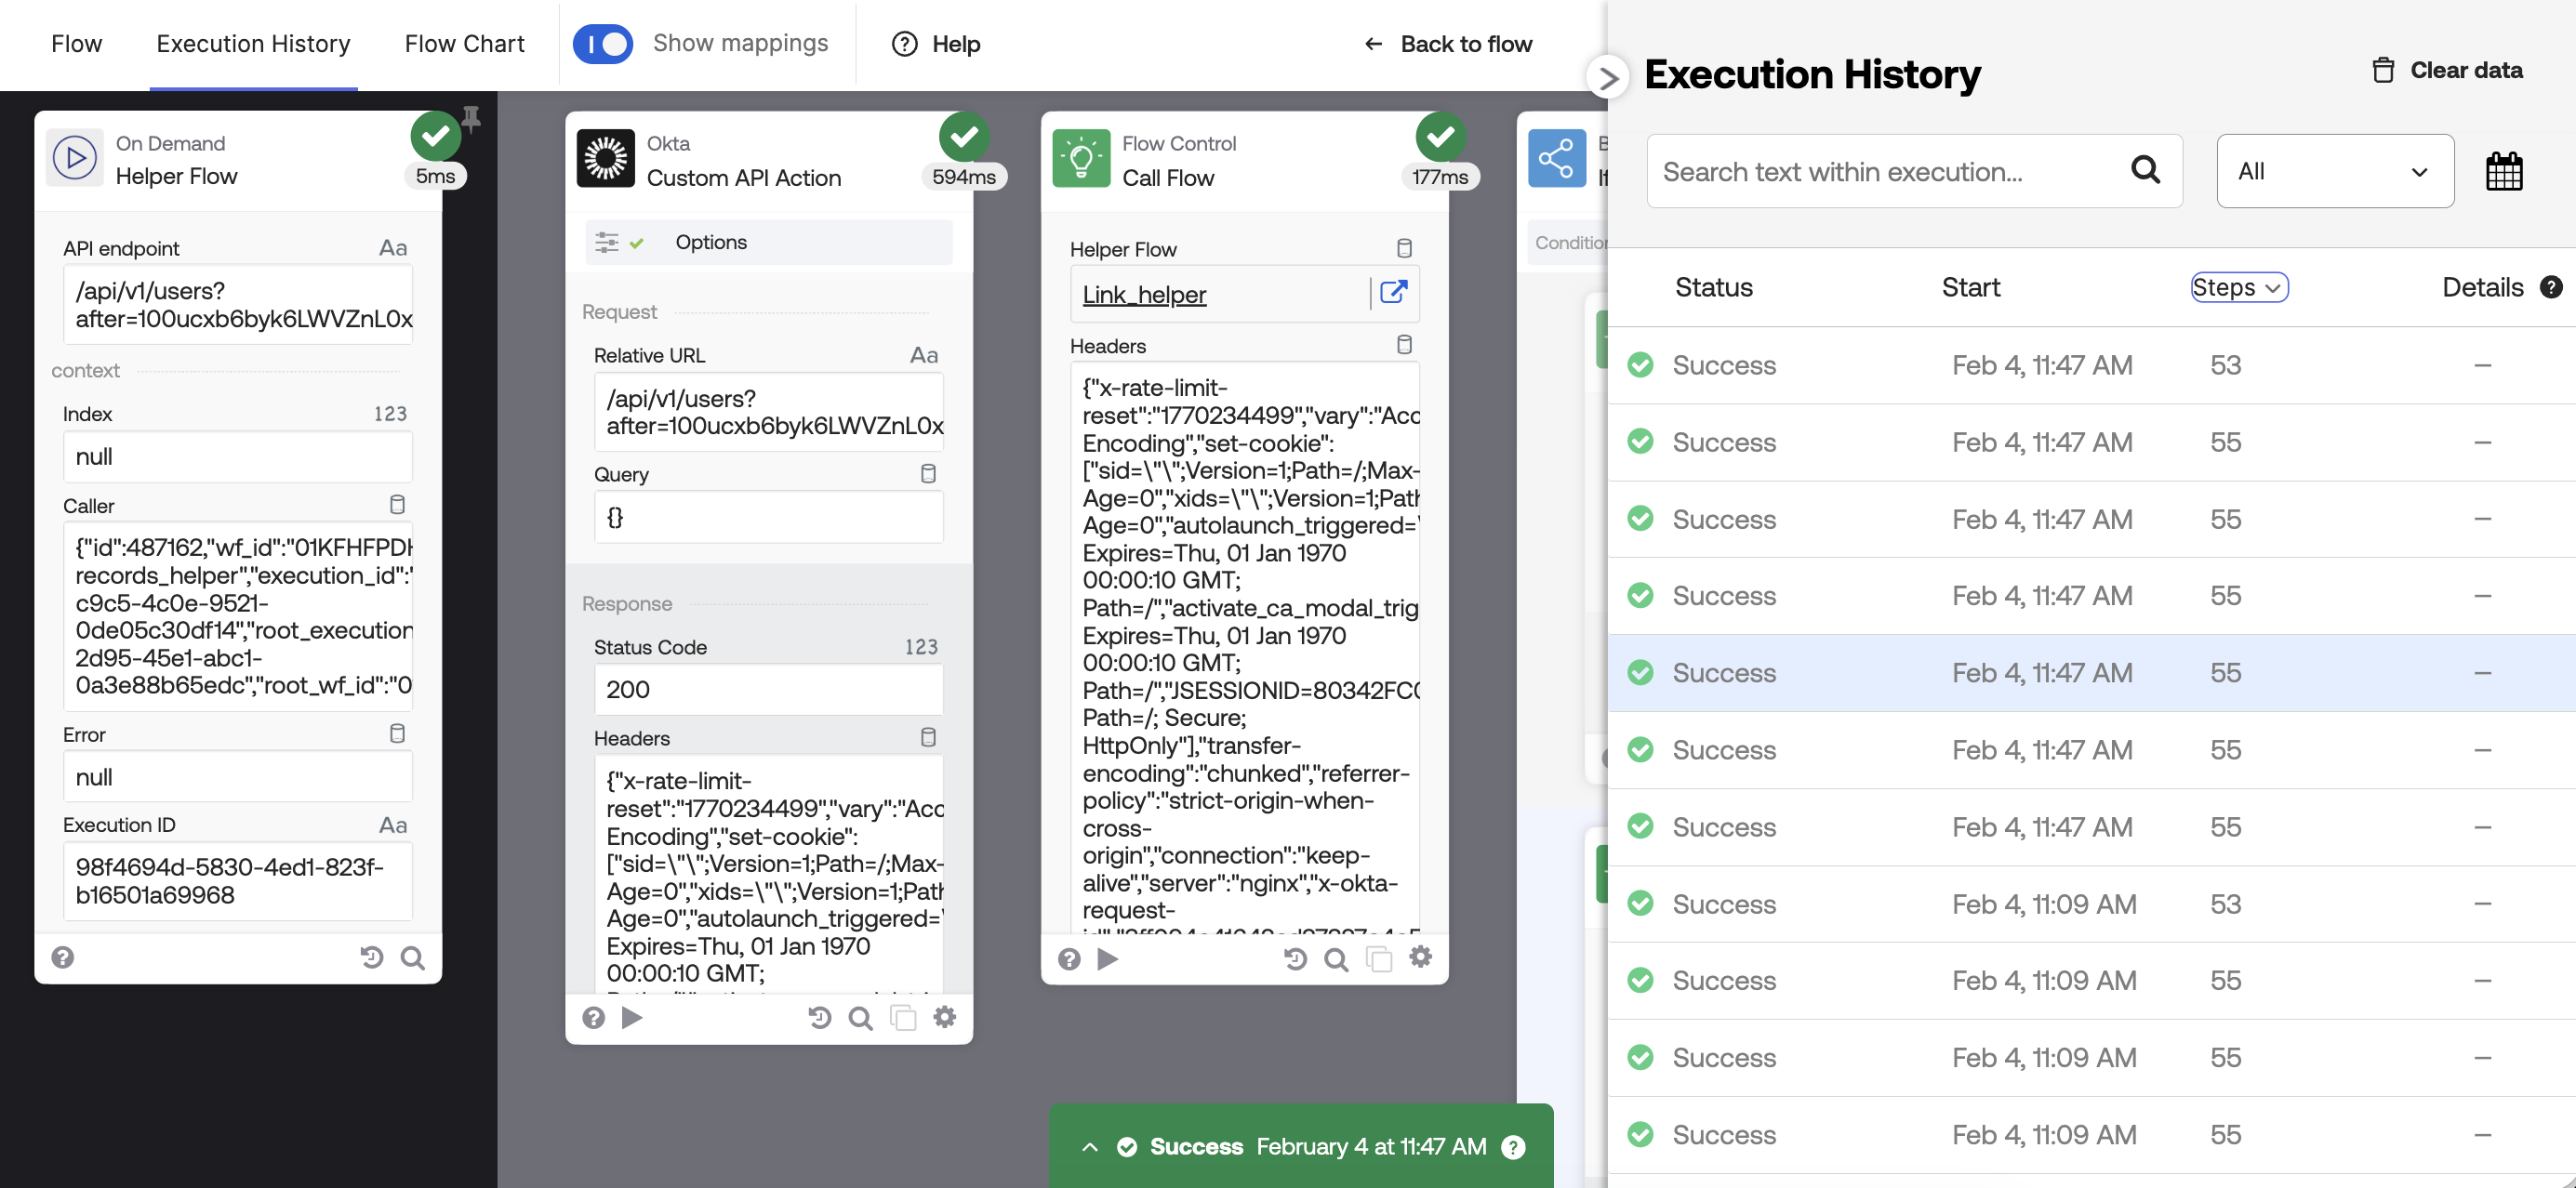
Select Steps to view how many total steps each flow took to execute:
Open the History Inspector view (green panel) to view the steps for each card in the execution:
Learn more about the Execution History view.
Okta Workflows resources
🚀 New to Okta Workflows? The Getting Started with Okta Workflows page has all the resources to help you get started.
📺 Like learning from videos? Watch Okta Workflows videos.
❓Have a question? Ask during community office hours, post on the community forum, or email me.
🙋🏻♀️ Want to learn from the community? Join the #okta-workflows channel on the Mac Admins Slack.
📖 Want to learn more about Okta and automation? Take the Okta Workflows training on Okta Learning.

Leave a comment